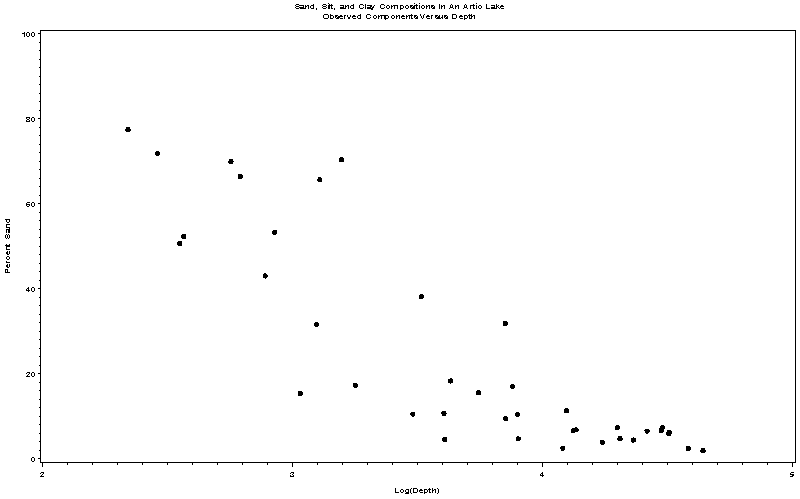
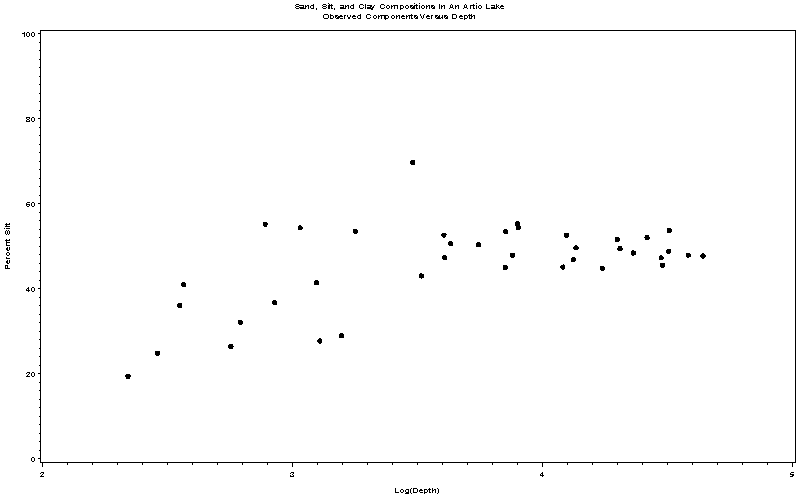
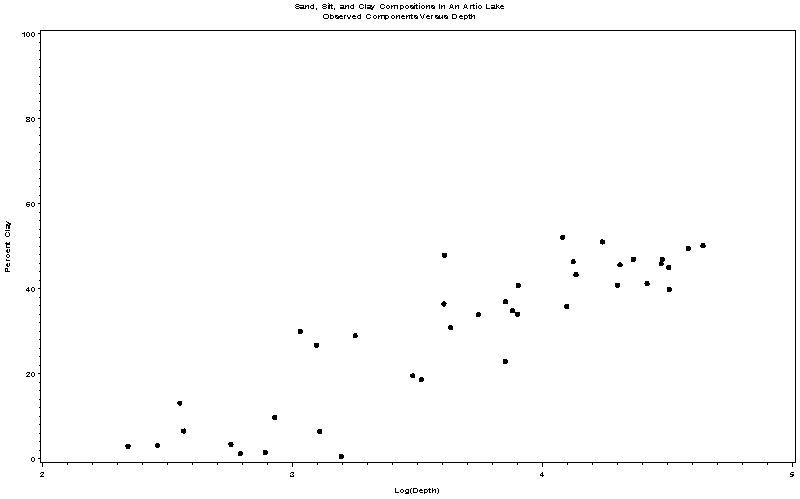
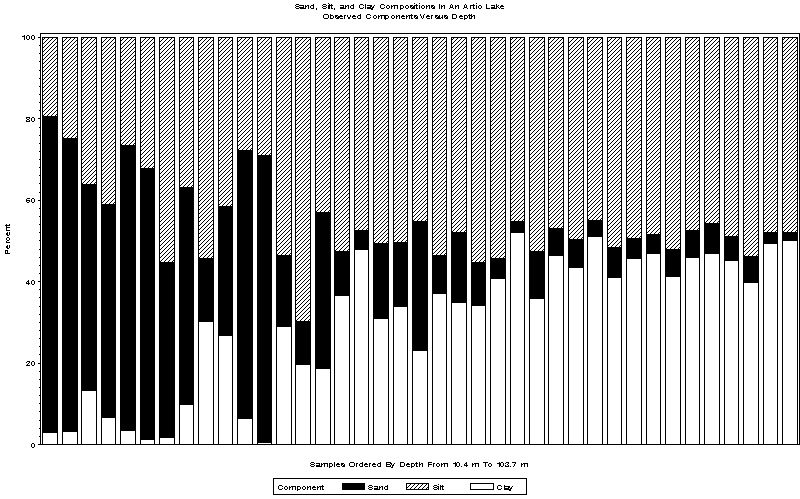
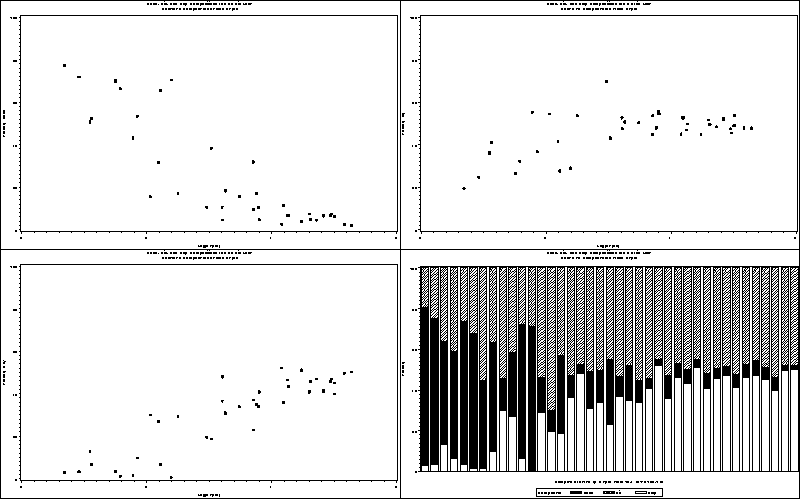
Sand, Silt, and Clay Compositions In An Artic Lake
Obs
Sediment Number
Percent Sand
Percent Silt
Percent Clay
Water Depth(m)
Log Ratio 1
Log Ratio 2
Log(Depth)
Axis1
Axis2
1
S1
77.5000
19.5000
3.0000
10.4
3.25167
1.87180
2.34181
12.7500
16.8875
2
S2
71.9000
24.9000
3.2000
11.7
3.11213
2.05172
2.45959
15.6500
21.5640
3
S3
50.7000
36.1000
13.2000
12.8
1.34571
1.00608
2.54945
31.2500
31.2635
4
S4
52.3571
41.0231
6.6199
13.0
2.06801
1.82406
2.56495
27.1314
35.5270
5
S5
70.0000
26.5000
3.5000
15.7
2.99573
2.02438
2.75366
16.7500
22.9497
6
S6
66.5000
32.2000
1.3000
16.3
3.93484
3.20960
2.79117
17.4000
27.8860
7
S7
43.1000
55.3000
1.6000
18.0
3.29352
3.54277
2.89037
29.2500
47.8912
8
S8
53.4000
36.8000
9.8000
18.7
1.69543
1.32312
2.92852
28.2000
31.8697
9
S9
15.5000
54.4000
30.1000
20.7
-0.66369
0.59184
3.03013
57.3000
47.1118
10
S10
31.7000
41.5000
26.8000
22.1
0.16791
0.43729
3.09558
47.5500
35.9401
11
S11
65.7000
27.8000
6.5000
22.4
2.31330
1.45323
3.10906
20.4000
24.0755
12
S12
70.4000
29.0000
0.6000
24.4
4.76502
3.87812
3.19458
15.1000
25.1147
13
S13
17.4000
53.6000
29.0000
25.8
-0.51083
0.61425
3.25037
55.8000
46.4190
14
S14
10.6000
69.8000
19.6000
32.5
-0.61468
1.27010
3.48124
54.5000
60.4486
15
S15
38.2000
43.1000
18.7000
33.6
0.71431
0.83500
3.51453
40.2500
37.3257
16
S16
10.8000
52.7000
36.5000
36.8
-1.21777
0.36730
3.60550
62.8500
45.6395
17
S18
4.6000
47.4000
48.0000
36.9
-2.34514
-0.01258
3.60821
71.7000
41.0496
18
S17
18.4000
50.7000
30.9000
37.8
-0.51841
0.49517
3.63231
56.2500
43.9075
19
S19
15.6000
50.4000
34.0000
42.2
-0.77909
0.39363
3.74242
59.2000
43.6477
20
S20
31.9000
45.1000
23.0000
47.0
0.32711
0.67339
3.85015
45.5500
39.0577
21
S21
9.5000
53.5000
37.0000
47.1
-1.35963
0.36876
3.85227
63.7500
46.3324
22
S22
17.1000
48.0000
34.9000
48.4
-0.71341
0.31871
3.87950
58.9000
41.5692
23
S23
10.5000
55.4000
34.1000
49.4
-1.17792
0.48528
3.89995
61.8000
47.9778
24
S24
4.7761
54.4279
40.7960
49.5
-2.14496
0.28829
3.90197
68.0100
47.1359
25
S25
2.6000
45.2000
52.2000
59.2
-2.99957
-0.14399
4.08092
74.8000
39.1443
26
S26
11.4000
52.7000
35.9000
60.1
-1.14712
0.38388
4.09601
62.2500
45.6395
27
S27
6.7000
46.9000
46.4000
61.7
-1.93519
0.01072
4.12228
69.8500
40.6166
28
S28
6.9000
49.7000
43.4000
62.4
-1.83894
0.13555
4.13357
68.2500
43.0415
29
S29
4.0000
44.9000
51.1000
69.3
-2.54749
-0.12935
4.23844
73.5500
38.8845
30
S30
7.4074
51.6517
40.9409
73.6
-1.70965
0.23239
4.29865
66.7668
44.7316
31
S31
4.8000
49.5000
45.7000
74.4
-2.25348
0.07987
4.30946
70.4500
42.8683
32
S32
4.5000
48.5000
47.0000
78.5
-2.34607
0.03142
4.36310
71.2500
42.0022
33
S33
6.6000
52.1000
41.3000
82.9
-1.83379
0.23230
4.41764
67.3500
45.1199
34
S34
6.7067
47.3473
45.9459
87.7
-1.92436
0.03005
4.47392
69.6196
41.0040
35
S35
7.4074
45.6456
46.9469
88.1
-1.84654
-0.02811
4.47847
69.7698
39.5303
36
S36
6.0000
48.9000
45.1000
90.4
-2.01712
0.08090
4.50424
69.5500
42.3486
37
S37
6.3000
53.8000
39.9000
90.6
-1.84583
0.29890
4.50645
66.8000
46.5922
38
S38
2.5000
48.0000
49.5000
97.7
-2.98568
-0.03077
4.58190
73.5000
41.5692
39
S39
2.0000
47.8000
50.2000
103.7
-3.22287
-0.04899
4.64150
74.1000
41.3960
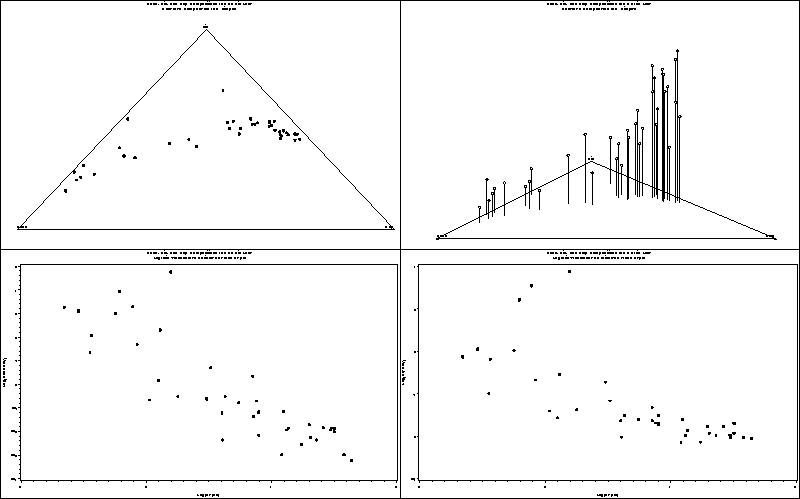
Sand, Silt, and Clay Compositions In An Artic Lake
Obs
Sand
Clay
Axis1
Axis2
Depth
LogDepth
Shape
Size
1
0
0
50
86.6025
0
0
Pyramid
0.25
2
100
0
0
0.0000
0
0
Pyramid
0.25
3
0
100
100
0.0000
0
0
Pyramid
0.25
4
0
0
50
86.6025
0
0
Pyramid
0.25
Sand, Silt, and Clay Compositions In An Artic Lake
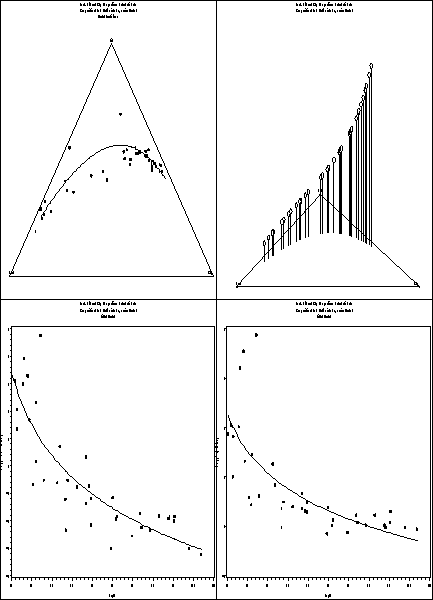
Compositional Data Multivariate Regression Model
The GLM Procedure
Number of Observations Read
39
Number of Observations Used
39
Sand, Silt, and Clay Compositions In An Artic Lake
Compositional Data Multivariate Regression Model
The GLM Procedure
Dependent Variable: Y1 Log Ratio 1
Source
DF
Sum of Squares
Mean Square
F Value
Pr > F
Model
1
132.6376326
132.6376326
104.06
<.0001
Error
37
47.1590967
1.2745702
Corrected Total
38
179.7967292
R-Square
Coeff Var
Root MSE
Y1 Mean
0.737709
-303.3498
1.128969
-0.372167
Source
DF
Type III SS
Mean Square
F Value
Pr > F
LogDepth
1
132.6376326
132.6376326
104.06
<.0001
Parameter
Estimate
Standard Error
t Value
Pr > |t|
Intercept
9.697382110
1.00351181
9.66
<.0001
LogDepth
-2.742906197
0.26888059
-10.20
<.0001
Sand, Silt, and Clay Compositions In An Artic Lake
Compositional Data Multivariate Regression Model
The GLM Procedure
Dependent Variable: Y2 Log Ratio 2
Source
DF
Sum of Squares
Mean Square
F Value
Pr > F
Model
1
21.18692678
21.18692678
43.20
<.0001
Error
37
18.14415574
0.49038259
Corrected Total
38
39.33108253
R-Square
Coeff Var
Root MSE
Y2 Mean
0.538682
89.70168
0.700273
0.780669
Source
DF
Type III SS
Mean Square
F Value
Pr > F
LogDepth
1
21.18692678
21.18692678
43.20
<.0001
Parameter
Estimate
Standard Error
t Value
Pr > |t|
Intercept
4.805157074
0.62245525
7.72
<.0001
LogDepth
-1.096254926
0.16678043
-6.57
<.0001
Sand, Silt, and Clay Compositions In An Artic Lake
Compositional Data Multivariate Regression Model
The GLM Procedure
Multivariate Analysis of Variance
Characteristic Roots and Vectors of: E Inverse * H, where H = Type III SSCP Matrix for LogDepth E = Error SSCP Matrix
Characteristic Root
Percent
Characteristic Vector V'EV=1
Y1
Y2
3.37676362
100.00
0.23660364
-0.19277507
0.00000000
0.00
-0.17202156
0.43040994
MANOVA Test Criteria and Exact F Statistics for the Hypothesis of No Overall LogDepth Effect H = Type III SSCP Matrix for LogDepth E = Error SSCP Matrix
S=1 M=0 N=17
Statistic
Value
F Value
Num DF
Den DF
Pr > F
Wilks' Lambda
0.22847933
60.78
2
36
<.0001
Pillai's Trace
0.77152067
60.78
2
36
<.0001
Hotelling-Lawley Trace
3.37676362
60.78
2
36
<.0001
Roy's Greatest Root
3.37676362
60.78
2
36
<.0001
Sand, Silt, and Clay Compositions In An Artic Lake
Compositional Data Multivariate Regression Model
The GLM Procedure
Multivariate Analysis of Variance
M Matrix Describing Transformed Variables
Y1
Y2
Y3
1
-1
Sand, Silt, and Clay Compositions In An Artic Lake
Compositional Data Multivariate Regression Model
The GLM Procedure
Multivariate Analysis of Variance
Characteristic Roots and Vectors of: E Inverse * H, where H = Type III SSCP Matrix for LogDepth E = Error SSCP Matrix
Variables have been transformed by the M Matrix
Characteristic Root
Percent
Characteristic Vector V'EV=1
Y3
3.28232484
100.00
0.26203948
MANOVA Test Criteria and Exact F Statistics for the Hypothesis of No Overall LogDepth Effect on the Variables Defined by the M Matrix Transformation H = Type III SSCP Matrix for LogDepth E = Error SSCP Matrix
S=1 M=-0.5 N=17.5
Statistic
Value
F Value
Num DF
Den DF
Pr > F
Wilks' Lambda
0.23351802
121.45
1
37
<.0001
Pillai's Trace
0.76648198
121.45
1
37
<.0001
Hotelling-Lawley Trace
3.28232484
121.45
1
37
<.0001
Roy's Greatest Root
3.28232484
121.45
1
37
<.0001
Sand, Silt, and Clay Compositions In An Artic Lake
Compositional Data Multivariate Regression Model
The GLM Procedure
Multivariate Analysis of Variance
Dependent Variable: Y3
Source
DF
Type III SS
Mean Square
F Value
Pr > F
LogDepth
1
47.80222567
47.80222567
121.45
<.0001
Error
37
14.56352675
0.39360883
Sand, Silt, and Clay Compositions In An Artic Lake