Bivariate Normal Data

Obs X1 X2
1 1913.51 1681.91
2 2591.71 1890.71
3 2651.02 1770.28
4 1630.09 1768.79
5 2283.16 1888.96
6 1850.69 1726.75
7 1426.03 1564.83
8 1458.22 1741.48
9 1707.98 1702.87
10 1557.66 1721.10
11 2253.83 1866.37
12 2114.58 1687.32
13 1388.64 1845.96
14 2444.87 1777.07
15 1651.14 1813.18
16 1920.93 1650.06
17 2083.64 1760.39
18 1871.60 1679.45
19 1357.45 1452.27
20 1924.17 1802.20
21 1855.32 1717.76
22 1861.35 1679.80
23 1581.16 1720.29
24 1949.70 1655.86
25 2444.13 1933.08
26 2835.52 1766.78
27 1578.48 1572.19
28 1860.09 1792.17
29 2037.24 1807.26
30 2446.43 1778.32


Bivariate Normal Data
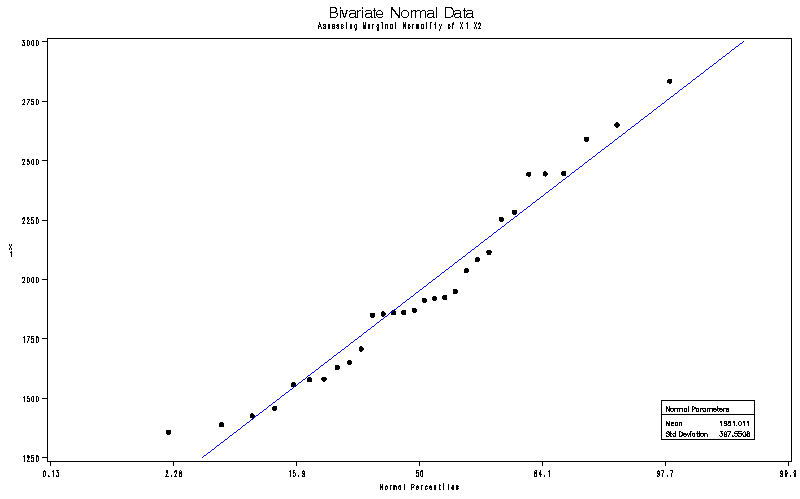
Assessing Marginal Normality of X1 X2

The UNIVARIATE Procedure
Variable: X1

Tests for Normality
Test Statistic p Value
Shapiro-Wilk W 0.95403 Pr < W 0.2165
Kolmogorov-Smirnov D 0.134648 Pr > D >0.1500
Cramer-von Mises W-Sq 0.07911 Pr > W-Sq 0.2122
Anderson-Darling A-Sq 0.470517 Pr > A-Sq 0.2352


The UNIVARIATE Procedure
Variable: X1

Q-Q plot for X1


Bivariate Normal Data
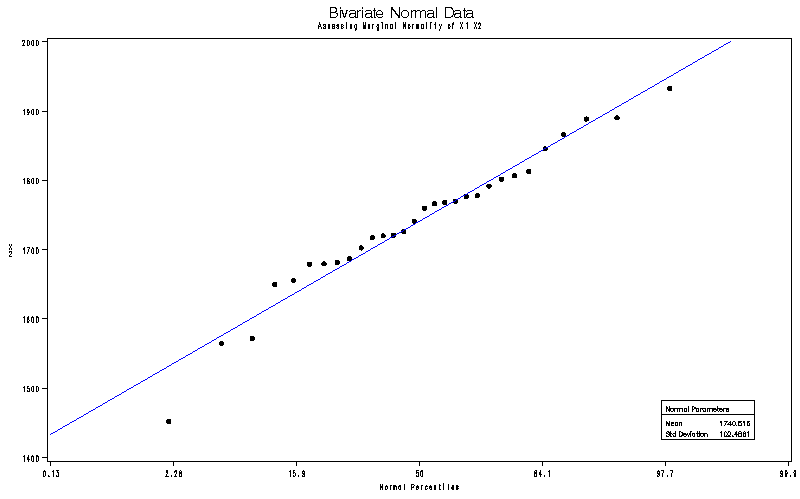
Assessing Marginal Normality of X1 X2

The UNIVARIATE Procedure
Variable: X2
Tests for Normality
Test Statistic p Value
Shapiro-Wilk W 0.966329 Pr < W 0.4442
Kolmogorov-Smirnov D 0.108971 Pr > D >0.1500
Cramer-von Mises W-Sq 0.048564 Pr > W-Sq >0.2500
Anderson-Darling A-Sq 0.334657 Pr > A-Sq >0.2500


The UNIVARIATE Procedure
Variable: X2
Q-Q plot for X2


The UNIVARIATE Procedure
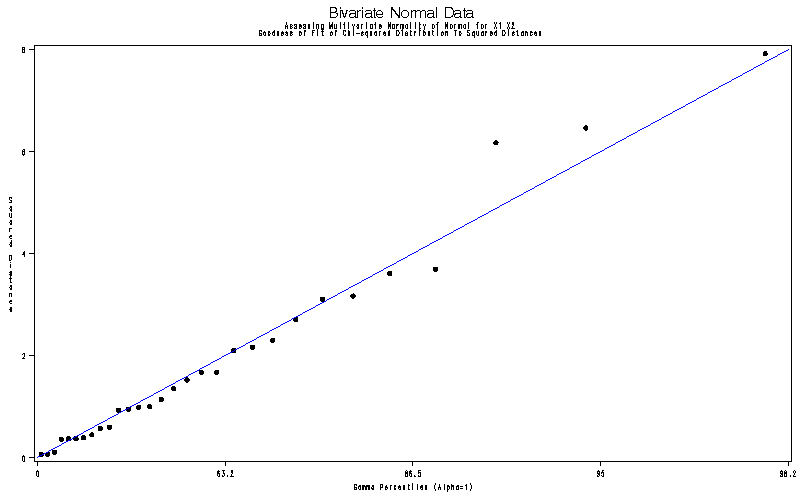
Variable: D2 (Squared Distance)

Q-Q plot for D2


Bivariate Normal Data
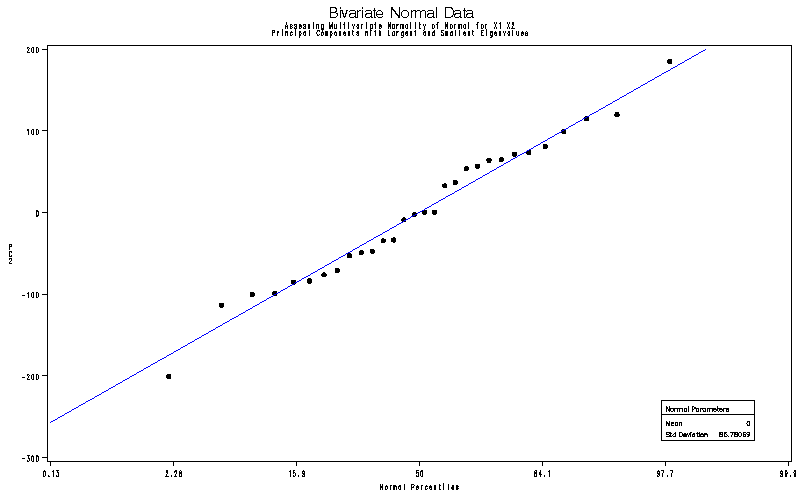
Assessing Multivariate Normality of Normal for X1 X2
Principal Components with Largest and Smallest Eigenvalues

The UNIVARIATE Procedure
Variable: PC1

Tests for Normality
Test Statistic p Value
Shapiro-Wilk W 0.955789 Pr < W 0.2409
Kolmogorov-Smirnov D 0.146647 Pr > D 0.0964
Cramer-von Mises W-Sq 0.082282 Pr > W-Sq 0.1932
Anderson-Darling A-Sq 0.476064 Pr > A-Sq 0.2289


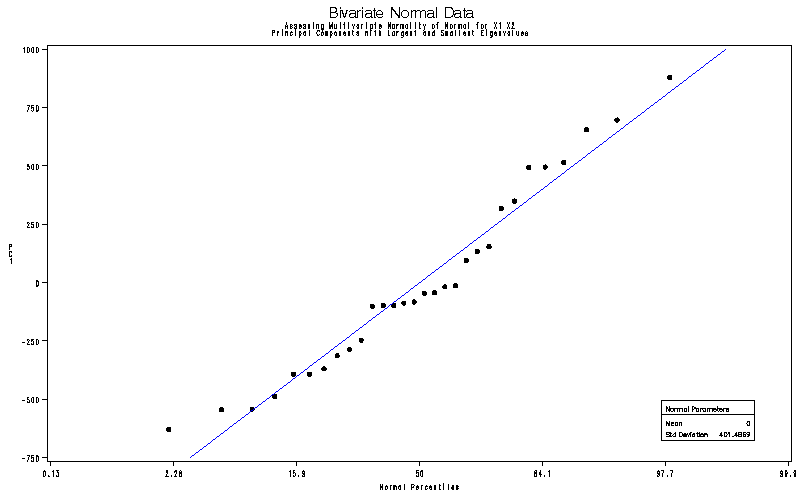
The UNIVARIATE Procedure
Variable: PC1

Q-Q plot for PC1


Bivariate Normal Data
Assessing Multivariate Normality of Normal for X1 X2
Principal Components with Largest and Smallest Eigenvalues

The UNIVARIATE Procedure
Variable: PC2

Tests for Normality
Test Statistic p Value
Shapiro-Wilk W 0.981551 Pr < W 0.8651
Kolmogorov-Smirnov D 0.101137 Pr > D >0.1500
Cramer-von Mises W-Sq 0.046568 Pr > W-Sq >0.2500
Anderson-Darling A-Sq 0.282813 Pr > A-Sq >0.2500


The UNIVARIATE Procedure
Variable: PC2

Q-Q plot for PC2


Bivariate Normal Data
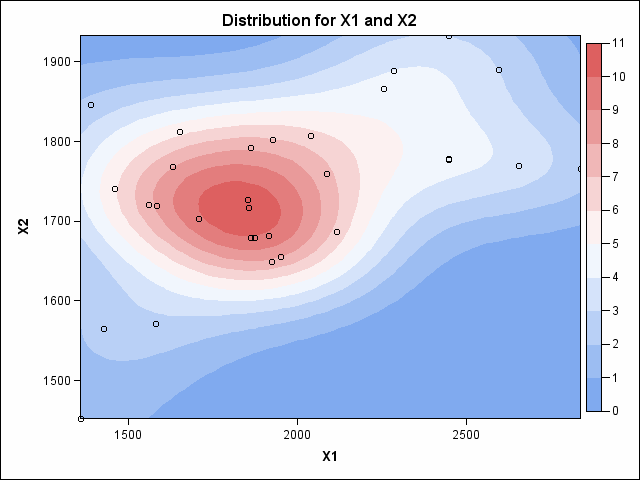
Non-parametric Bivariate Density Estimate

The KDE Procedure

Contour Plot with Scatter Plot

Density Surface


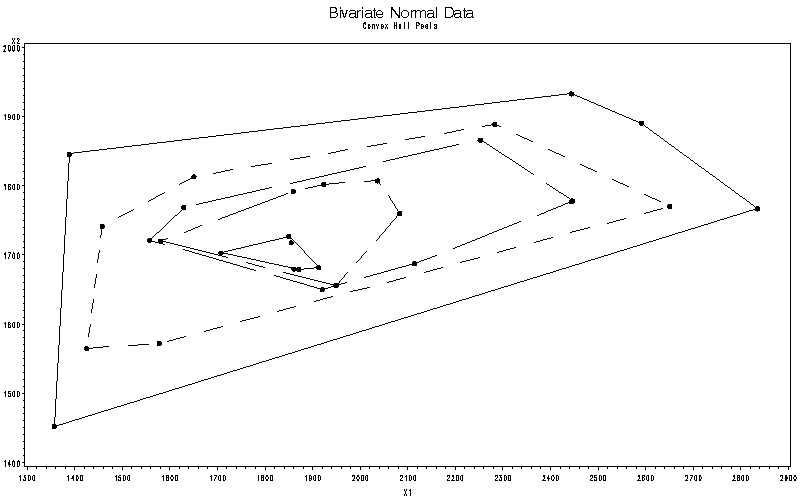
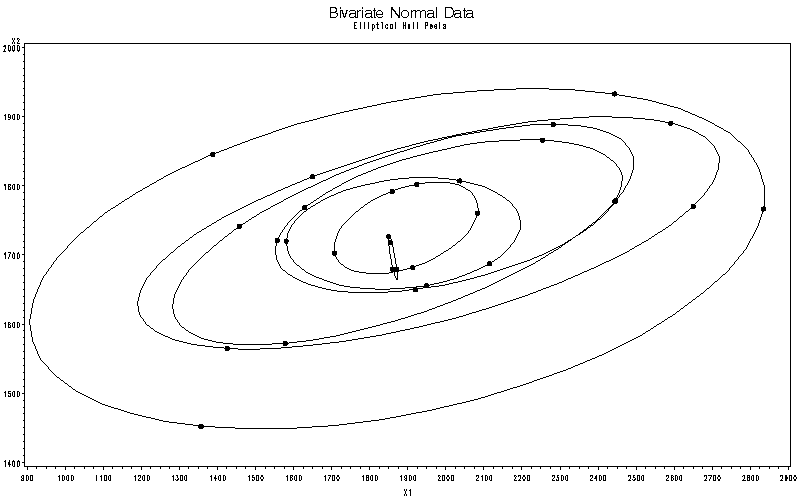
Plot of X2 * X1 = PEEL


Plot of X2 * X1 = PEEL