2 SAS System for Mixed Models (1996)
3 by Ramon C. Littell, Ph.D., George A. Milliken, Ph.D.,
4 Walter W. Stroup, Ph.D., and Russell D. Wolfinger, Ph.D.
5
6 SAS Publications order # 55235
7 ISBN 1-55544-779-1
8 Copyright 1996 by SAS Institute Inc., Cary, NC, USA
9
10 This file contains the SAS code needed to produce the output
11 in this book with Release 6.11 of the SAS System.
12 ----------------------------------------------------------------*/
13
14 /* Updated: 12JUN02 */
15 /* Modifications by Geaghan 14Nov02 */
16
17 options ps=256 ls=100 nocenter nodate nonumber;
18 title1 'Repeated measures - from SAS System for Mixed Models, 1996, Littell, et al.';
19 data weights;
20 input subj program$ s1 s2 s3 s4 s5 s6 s7;
21 datalines;
NOTE: The data set WORK.WEIGHTS has 57 observations and 9 variables.
NOTE: DATA statement used:
real time 0.04 seconds
79 ;
80
81 data weight2;
82 set weights;
83 time=1; strength=s1; output;
84 time=2; strength=s2; output;
85 time=3; strength=s3; output;
86 time=4; strength=s4; output;
87 time=5; strength=s5; output;
88 time=6; strength=s6; output;
89 time=7; strength=s7; output;
90 * label subj = subject (experimental unit);
91 * label program = weight lifting program;
92 keep subj program time strength;
93 run;
NOTE: There were 57 observations read from the data set WORK.WEIGHTS.
NOTE: The data set WORK.WEIGHT2 has 399 observations and 4 variables.
NOTE: DATA statement used:
real time 0.00 seconds
94
95 proc sort data=weight2; by program time; run;
NOTE: There were 399 observations read from the data set WORK.WEIGHT2.
NOTE: The data set WORK.WEIGHT2 has 399 observations and 4 variables.
NOTE: PROCEDURE SORT used:
real time 0.00 seconds
96 proc means data=weight2 noprint; by program time;
97 var strength;
98 output out=avg mean=strength;
99 run;
NOTE: There were 399 observations read from the data set WORK.WEIGHT2.
NOTE: The data set WORK.AVG has 21 observations and 5 variables.
NOTE: PROCEDURE MEANS used:
real time 0.05 seconds
100
101 options ps=56 ls=100;
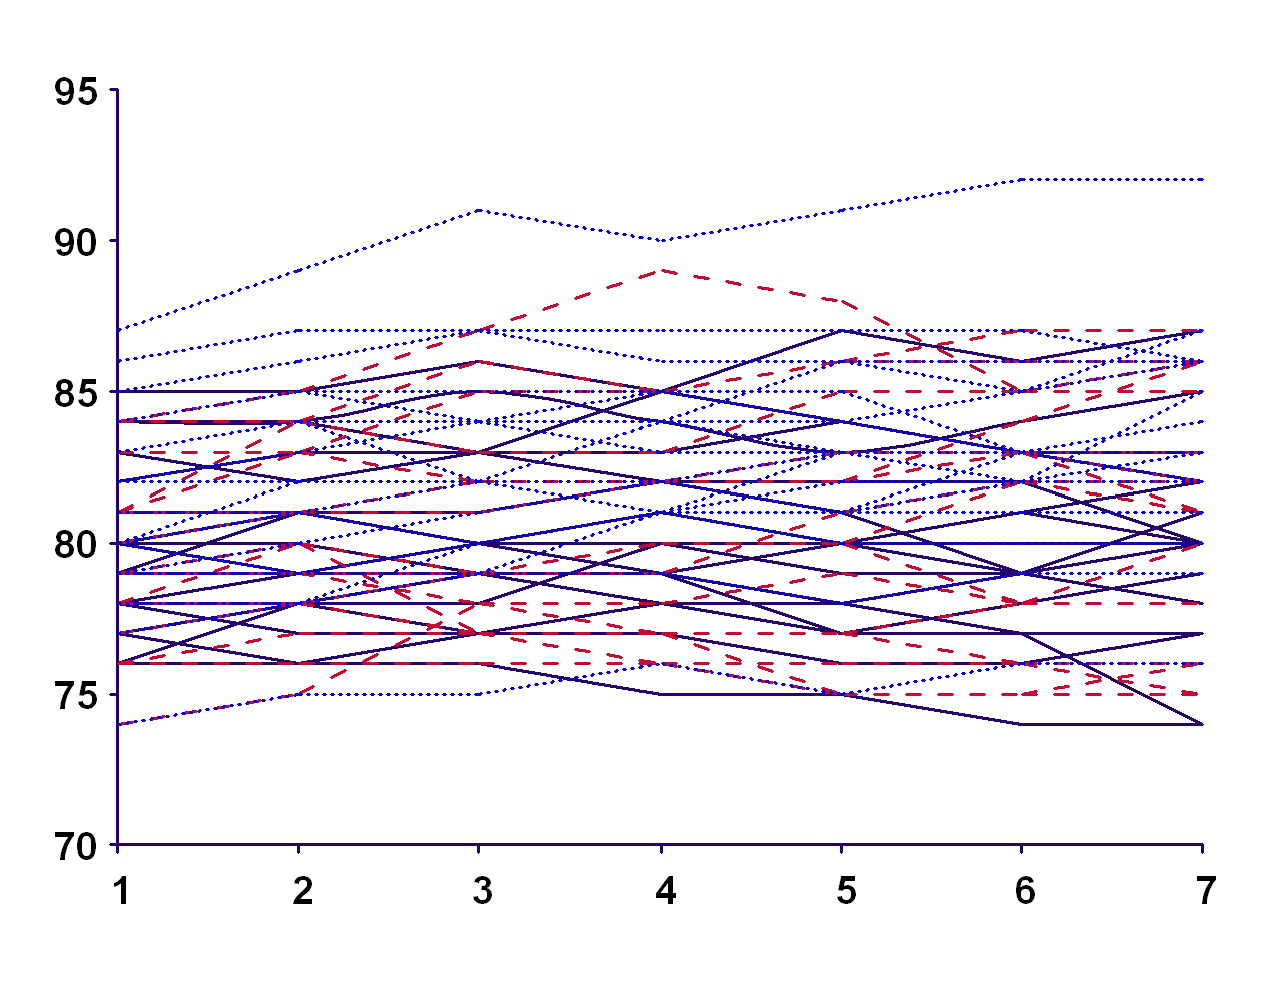
102 title2 'Plot of mean strength over time for each program';
103 proc plot data=avg; plot strength*time=program; run;
104 options ps=256 ls=100;
NOTE: There were 21 observations read from the data set WORK.AVG.
NOTE: The PROCEDURE PLOT printed page 1.
NOTE: PROCEDURE PLOT used:
real time 0.05 seconds
Repeated measures - from SAS System for Mixed Models, 1996, Littell, et al.
Plot of mean strength over time for each program
Plot of strength*time. Symbol is value of program.
strength |
|
83.5 + W - treatment group lifting increasing weight over time
| R - treatment group doing increasing number of lifts over time
| C - control group, no weight lifting
|
| W
83.0 +
|
|
| W
| W
82.5 + W
|
|
|
|
82.0 +
| W
|
| W
|
81.5 +
|
| R
|
| R R
81.0 + W R
|
| R
|
| R
80.5 +
|
|
|
| C
80.0 + C C
|
| C C
| R
| C C
79.5 +
|
---+-------------+-------------+-------------+-------------+-------------+-------------+--
1 2 3 4 5 6 7
time
106 title2 'Simple PROC MIXED with random statement';
107 proc mixed data=weight2; class program subj time;
108 model strength = program time program*time;
109 random subj(program);
110 run;
NOTE: Convergence criteria met.
NOTE: The PROCEDURE MIXED printed page 2.
NOTE: PROCEDURE MIXED used:
real time 0.10 seconds
Repeated measures - from SAS System for Mixed Models, 1996, Littell, et al.
Simple PROC MIXED with random statement
The Mixed Procedure
Model Information
Data Set WORK.WEIGHT2
Dependent Variable strength
Covariance Structure Variance Components
Estimation Method REML
Residual Variance Method Profile
Fixed Effects SE Method Model-Based
Degrees of Freedom Method Containment
Class Level Information
Class Levels Values
program 3 CONT RI WI
subj 21 1 2 3 4 5 6 7 8 9 10 11 12 13 14 15 16 17 18 19 20 21
time 7 1 2 3 4 5 6 7
Dimensions
Covariance Parameters 2
Columns in X 32
Columns in Z 57
Subjects 1
Max Obs Per Subject 399
Observations Used 399
Observations Not Used 0
Total Observations 399
Iteration History
Iteration Evaluations -2 Res Log Like Criterion
0 1 2033.88298356
1 1 1420.82019617 0.00000000
Convergence criteria met.
Covariance Parameter Estimates
Cov Parm Estimate
subj(program) 9.6033
Residual 1.1969
Fit Statistics
-2 Res Log Likelihood 1420.8
AIC (smaller is better) 1424.8
AICC (smaller is better) 1424.9
BIC (smaller is better) 1428.9
Type 3 Tests of Fixed Effects
Effect Num DF Den DF F Value Pr > F
program 2 54 3.07 0.0548
time 6 324 7.43 <.0001
program*time 12 324 2.99 0.0005
112 title2 'PROC MIXED with compound symmetry';
113 proc mixed data=weight2; class program subj time;
114 model strength = program time program*time;
115 repeated / type=cs sub=subj(program) r rcorr;
116 run;
NOTE: Convergence criteria met.
NOTE: The PROCEDURE MIXED printed page 3.
NOTE: PROCEDURE MIXED used:
real time 0.04 seconds
Repeated measures - from SAS System for Mixed Models, 1996, Littell, et al.
PROC MIXED with compound symmetry
The Mixed Procedure
Model Information
Data Set WORK.WEIGHT2
Dependent Variable strength
Covariance Structure Compound Symmetry
Subject Effect subj(program)
Estimation Method REML
Residual Variance Method Profile
Fixed Effects SE Method Model-Based
Degrees of Freedom Method Between-Within
Class Level Information
Class Levels Values
program 3 CONT RI WI
subj 21 1 2 3 4 5 6 7 8 9 10 11 12 13 14 15 16 17 18 19 20 21
time 7 1 2 3 4 5 6 7
Dimensions
Covariance Parameters 2
Columns in X 32
Columns in Z 0
Subjects 57
Max Obs Per Subject 7
Observations Used 399
Observations Not Used 0
Total Observations 399
Iteration History
Iteration Evaluations -2 Res Log Like Criterion
0 1 2033.88298356
1 1 1420.82019617 0.00000000
Convergence criteria met.
Estimated R Matrix for subj(program) 1 CONT
Row Col1 Col2 Col3 Col4 Col5 Col6 Col7
1 10.8002 9.6033 9.6033 9.6033 9.6033 9.6033 9.6033
2 9.6033 10.8002 9.6033 9.6033 9.6033 9.6033 9.6033
3 9.6033 9.6033 10.8002 9.6033 9.6033 9.6033 9.6033
4 9.6033 9.6033 9.6033 10.8002 9.6033 9.6033 9.6033
5 9.6033 9.6033 9.6033 9.6033 10.8002 9.6033 9.6033
6 9.6033 9.6033 9.6033 9.6033 9.6033 10.8002 9.6033
7 9.6033 9.6033 9.6033 9.6033 9.6033 9.6033 10.8002
Estimated R Correlation Matrix for subj(program) 1 CONT
Row Col1 Col2 Col3 Col4 Col5 Col6 Col7
1 1.0000 0.8892 0.8892 0.8892 0.8892 0.8892 0.8892
2 0.8892 1.0000 0.8892 0.8892 0.8892 0.8892 0.8892
3 0.8892 0.8892 1.0000 0.8892 0.8892 0.8892 0.8892
4 0.8892 0.8892 0.8892 1.0000 0.8892 0.8892 0.8892
5 0.8892 0.8892 0.8892 0.8892 1.0000 0.8892 0.8892
6 0.8892 0.8892 0.8892 0.8892 0.8892 1.0000 0.8892
7 0.8892 0.8892 0.8892 0.8892 0.8892 0.8892 1.0000
Covariance Parameter Estimates
Cov Parm Subject Estimate
CS subj(program) 9.6033
Residual 1.1969
Fit Statistics
-2 Res Log Likelihood 1420.8
AIC (smaller is better) 1424.8 Akaike Information Criterion (AIC)
AICC (smaller is better) 1424.9 Akaike Information Corrected Criterion (AICC)
BIC (smaller is better) 1428.9 Bayesian Information Criterion (BIC)
Null Model Likelihood Ratio Test
DF Chi-Square Pr > ChiSq
1 613.06 <.0001
Type 3 Tests of Fixed Effects
Effect Num DF Den DF F Value Pr > F
program 2 54 3.07 0.0548
time 6 324 7.43 <.0001
program*time 12 324 2.99 0.0005
118 title2 'PROC MIXED with AR(1) covariance';
119 proc mixed data=weight2; class program subj time;
120 model strength = program time program*time;
121 repeated / type=ar(1) sub=subj(program) r rcorr;
122 run;
NOTE: Convergence criteria met.
NOTE: The PROCEDURE MIXED printed page 4.
NOTE: PROCEDURE MIXED used:
real time 0.04 seconds
Repeated measures - from SAS System for Mixed Models, 1996, Littell, et al.
PROC MIXED with AR(1) covariance
The Mixed Procedure
Model Information
Data Set WORK.WEIGHT2
Dependent Variable strength
Covariance Structure Autoregressive
Subject Effect subj(program)
Estimation Method REML
Residual Variance Method Profile
Fixed Effects SE Method Model-Based
Degrees of Freedom Method Between-Within
Class Level Information
Class Levels Values
program 3 CONT RI WI
subj 21 1 2 3 4 5 6 7 8 9 10 11 12 13 14 15 16 17 18 19 20 21
time 7 1 2 3 4 5 6 7
Dimensions
Covariance Parameters 2
Columns in X 32
Columns in Z 0
Subjects 57
Max Obs Per Subject 7
Observations Used 399
Observations Not Used 0
Total Observations 399
Iteration History
Iteration Evaluations -2 Res Log Like Criterion
0 1 2033.88298356
1 2 1266.80350600 0.00000002
2 1 1266.80350079 0.00000000
Convergence criteria met.
Estimated R Matrix for subj(program) 1 CONT
Row Col1 Col2 Col3 Col4 Col5 Col6 Col7
1 10.7600 10.2411 9.7473 9.2772 8.8298 8.4040 7.9988
2 10.2411 10.7600 10.2411 9.7473 9.2772 8.8298 8.4040
3 9.7473 10.2411 10.7600 10.2411 9.7473 9.2772 8.8298
4 9.2772 9.7473 10.2411 10.7600 10.2411 9.7473 9.2772
5 8.8298 9.2772 9.7473 10.2411 10.7600 10.2411 9.7473
6 8.4040 8.8298 9.2772 9.7473 10.2411 10.7600 10.2411
7 7.9988 8.4040 8.8298 9.2772 9.7473 10.2411 10.7600
Estimated R Correlation Matrix for subj(program) 1 CONT
Row Col1 Col2 Col3 Col4 Col5 Col6 Col7
1 1.0000 0.9518 0.9059 0.8622 0.8206 0.7810 0.7434
2 0.9518 1.0000 0.9518 0.9059 0.8622 0.8206 0.7810
3 0.9059 0.9518 1.0000 0.9518 0.9059 0.8622 0.8206
4 0.8622 0.9059 0.9518 1.0000 0.9518 0.9059 0.8622
5 0.8206 0.8622 0.9059 0.9518 1.0000 0.9518 0.9059
6 0.7810 0.8206 0.8622 0.9059 0.9518 1.0000 0.9518
7 0.7434 0.7810 0.8206 0.8622 0.9059 0.9518 1.0000
Covariance Parameter Estimates
Cov Parm Subject Estimate
AR(1) subj(program) 0.9518
Residual 10.7600
Fit Statistics
-2 Res Log Likelihood 1266.8
AIC (smaller is better) 1270.8
AICC (smaller is better) 1270.8
BIC (smaller is better) 1274.9
Null Model Likelihood Ratio Test
DF Chi-Square Pr > ChiSq
1 767.08 <.0001
Type 3 Tests of Fixed Effects
Effect Num DF Den DF F Value Pr > F
program 2 54 3.11 0.0528
time 6 324 4.30 0.0003
program*time 12 324 1.17 0.3007
124 title2 'PROC MIXED with unstructured covariance';
125 proc mixed data=weight2; class program subj time;
126 model strength = program time program*time;
127 repeated / type=un sub=subj(program) r rcorr;
128 run;
NOTE: Convergence criteria met.
NOTE: The PROCEDURE MIXED printed page 5.
NOTE: PROCEDURE MIXED used:
real time 0.17 seconds
Repeated measures - from SAS System for Mixed Models, 1996, Littell, et al.
PROC MIXED with unstructured covariance
The Mixed Procedure
Model Information
Data Set WORK.WEIGHT2
Dependent Variable strength
Covariance Structure Unstructured
Subject Effect subj(program)
Estimation Method REML
Residual Variance Method None
Fixed Effects SE Method Model-Based
Degrees of Freedom Method Between-Within
Class Level Information
Class Levels Values
program 3 CONT RI WI
subj 21 1 2 3 4 5 6 7 8 9 10 11 12 13 14 15 16 17 18 19 20 21
time 7 1 2 3 4 5 6 7
Dimensions
Covariance Parameters 28
Columns in X 32
Columns in Z 0
Subjects 57
Max Obs Per Subject 7
Observations Used 399
Observations Not Used 0
Total Observations 399
Iteration History
Iteration Evaluations -2 Res Log Like Criterion
0 1 2033.88298356
1 1 1234.89572573 0.00000000
Convergence criteria met.
Estimated R Matrix for subj(program) 1 CONT
Row Col1 Col2 Col3 Col4 Col5 Col6 Col7
1 8.7804 8.7573 8.9659 8.1986 8.6784 8.2206 8.4172
2 8.7573 9.4732 9.4633 8.5688 9.2015 8.7310 8.6878
3 8.9659 9.4633 10.7083 9.9268 10.6664 10.0704 10.2142
4 8.1986 8.5688 9.9268 10.0776 10.5998 9.8989 10.0436
5 8.6784 9.2015 10.6664 10.5998 12.0954 11.3447 11.3641
6 8.2206 8.7310 10.0704 9.8989 11.3447 11.7562 11.6504
7 8.4172 8.6878 10.2142 10.0436 11.3641 11.6504 12.7104
Estimated R Correlation Matrix for subj(program) 1 CONT
Row Col1 Col2 Col3 Col4 Col5 Col6 Col7
1 1.0000 0.9602 0.9246 0.8716 0.8421 0.8091 0.7968
2 0.9602 1.0000 0.9396 0.8770 0.8596 0.8273 0.7917
3 0.9246 0.9396 1.0000 0.9556 0.9372 0.8975 0.8755
4 0.8716 0.8770 0.9556 1.0000 0.9601 0.9094 0.8874
5 0.8421 0.8596 0.9372 0.9601 1.0000 0.9514 0.9165
6 0.8091 0.8273 0.8975 0.9094 0.9514 1.0000 0.9531
7 0.7968 0.7917 0.8755 0.8874 0.9165 0.9531 1.0000
Covariance Parameter Estimates
Cov Parm Subject Estimate
UN(1,1) subj(program) 8.7804
UN(2,1) subj(program) 8.7573
UN(2,2) subj(program) 9.4732
UN(3,1) subj(program) 8.9659
UN(3,2) subj(program) 9.4633
UN(3,3) subj(program) 10.7083
UN(4,1) subj(program) 8.1986
UN(4,2) subj(program) 8.5688
UN(4,3) subj(program) 9.9268
UN(4,4) subj(program) 10.0776
UN(5,1) subj(program) 8.6784
UN(5,2) subj(program) 9.2015
UN(5,3) subj(program) 10.6664
UN(5,4) subj(program) 10.5998
UN(5,5) subj(program) 12.0954
UN(6,1) subj(program) 8.2206
UN(6,2) subj(program) 8.7310
UN(6,3) subj(program) 10.0704
UN(6,4) subj(program) 9.8989
UN(6,5) subj(program) 11.3447
UN(6,6) subj(program) 11.7562
UN(7,1) subj(program) 8.4172
UN(7,2) subj(program) 8.6878
UN(7,3) subj(program) 10.2142
UN(7,4) subj(program) 10.0436
UN(7,5) subj(program) 11.3641
UN(7,6) subj(program) 11.6504
UN(7,7) subj(program) 12.7104
Fit Statistics
-2 Res Log Likelihood 1234.9
AIC (smaller is better) 1290.9
AICC (smaller is better) 1295.5
BIC (smaller is better) 1348.1
Null Model Likelihood Ratio Test
DF Chi-Square Pr > ChiSq
27 798.99 <.0001
Type 3 Tests of Fixed Effects
Effect Num DF Den DF F Value Pr > F
program 2 54 3.07 0.0548
time 6 54 7.12 <.0001
program*time 12 54 1.57 0.1297
Which of the models above is better?
Fit Statistics Random CS AR(1) Un
-2 Res Log Likelihood 1420.8 1420.8 1266.8 1234.9
AIC (smaller is better) 1424.8 1424.8 1270.8 1290.9
AICC (smaller is better) 1424.9 1424.9 1270.8 1295.5
BIC (smaller is better) 1428.9 1428.9 1274.9 1348.1
Covariance Parameter estimates 2 2 2 28
Test AR(1) versus Unstructured: c2 = (1266.8 - 1234.9) =
31.9 with 26 d.f. (P> c2 = 0.19645)
Critical value of c2a=0.05 = 38.885
Fixed effects Type III test results
Effect Random CS AR(1) Un
program 0.0548 0.0548 0.0528 0.0548
time <.0001 <.0001 0.0003 <.0001
program*time 0.0005 0.0005 0.3007 0.1297
130 title2 'REGRESSION with AR(1) covariance';
131 proc mixed data=weight2; class program subj;
132 model strength = program time time*program time*time time*time*program / htype=1;
133 repeated / type=ar(1) sub=subj(program);
134 run;
NOTE: Convergence criteria met.
NOTE: The PROCEDURE MIXED printed page 6.
NOTE: PROCEDURE MIXED used:
real time 0.04 seconds
Repeated measures - from SAS System for Mixed Models, 1996, Littell, et al.
REGRESSION with AR(1) covariance
The Mixed Procedure
Model Information
Data Set WORK.WEIGHT2
Dependent Variable strength
Covariance Structure Autoregressive
Subject Effect subj(program)
Estimation Method REML
Residual Variance Method Profile
Fixed Effects SE Method Model-Based
Degrees of Freedom Method Between-Within
Class Level Information
Class Levels Values
program 3 CONT RI WI
subj 21 1 2 3 4 5 6 7 8 9 10 11 12 13 14 15 16 17 18 19 20 21
Dimensions
Covariance Parameters 2
Columns in X 12
Columns in Z 0
Subjects 57
Max Obs Per Subject 7
Observations Used 399
Observations Not Used 0
Total Observations 399
Iteration History
Iteration Evaluations -2 Res Log Like Criterion
0 1 2078.51675124
1 2 1281.03040653 0.00000125
2 1 1281.03005389 0.00000000
Convergence criteria met.
Covariance Parameter Estimates
Cov Parm Subject Estimate
AR(1) subj(program) 0.9523
Residual 10.7585
Fit Statistics
-2 Res Log Likelihood 1281.0
AIC (smaller is better) 1285.0
AICC (smaller is better) 1285.1
BIC (smaller is better) 1289.1
Null Model Likelihood Ratio Test
DF Chi-Square Pr > ChiSq
1 797.49 <.0001
Type 1 Tests of Fixed Effects
Effect Num DF Den DF F Value Pr > F
program 2 54 3.10 0.0530
time 1 336 12.69 0.0004
time*program 2 336 4.75 0.0093
time*time 1 336 7.18 0.0077
time*time*program 2 336 0.88 0.4167
136 title2 'REGRESSION with AR(1) covariance and NOINT';
137 proc mixed data=weight2;
138 class program subj;
139 model strength = program time*program time*time*program / noint s htype=1;
140 repeated / type=ar(1) sub=subj(program);
141 run;
NOTE: Convergence criteria met.
NOTE: The PROCEDURE MIXED printed page 7.
NOTE: PROCEDURE MIXED used:
real time 0.05 seconds
Repeated measures - from SAS System for Mixed Models, 1996, Littell, et al.
REGRESSION with AR(1) covariance and NOINT
The Mixed Procedure
Model Information
Data Set WORK.WEIGHT2
Dependent Variable strength
Covariance Structure Autoregressive
Subject Effect subj(program)
Estimation Method REML
Residual Variance Method Profile
Fixed Effects SE Method Model-Based
Degrees of Freedom Method Between-Within
Class Level Information
Class Levels Values
program 3 CONT RI WI
subj 21 1 2 3 4 5 6 7 8 9 10 11 12 13 14 15 16 17 18 19 20 21
Dimensions
Covariance Parameters 2
Columns in X 9
Columns in Z 0
Subjects 57
Max Obs Per Subject 7
Observations Used 399
Observations Not Used 0
Total Observations 399
Iteration History
Iteration Evaluations -2 Res Log Like Criterion
0 1 2078.51675124
1 2 1281.03040653 0.00000125
2 1 1281.03005389 0.00000000
Convergence criteria met.
Covariance Parameter Estimates
Cov Parm Subject Estimate
AR(1) subj(program) 0.9523
Residual 10.7585
Fit Statistics
-2 Res Log Likelihood 1281.0
AIC (smaller is better) 1285.0
AICC (smaller is better) 1285.1
BIC (smaller is better) 1289.1
Null Model Likelihood Ratio Test
DF Chi-Square Pr > ChiSq
1 797.49 <.0001
Solution for Fixed Effects
Standard
Effect program Estimate Error DF t Value Pr > |t|
program CONT 79.5708 0.7972 54 99.82 <.0001
program RI 78.9054 0.8913 54 88.53 <.0001
program WI 80.4928 0.7780 54 103.47 <.0001
time*program CONT 0.2092 0.2353 336 0.89 0.3746
time*program RI 0.8606 0.2630 336 3.27 0.0012
time*program WI 0.5861 0.2296 336 2.55 0.0111
time*time*program CONT -0.02930 0.02731 336 -1.07 0.2842
time*time*program RI -0.07767 0.03054 336 -2.54 0.0114
time*time*program WI -0.03063 0.02666 336 -1.15 0.2514
Type 1 Tests of Fixed Effects
Effect Num DF Den DF F Value Pr > F
program 3 54 12910.8 <.0001
time*program 3 336 7.39 <.0001
time*time*program 3 336 2.98 0.0316