27 options ps=52 ls=111;
28 proc plot data=Meadowfoam; TITLE2 'Plot of the raw data';
29 plot Flowers * Intensity = TimeName;
30 RUN;
30 ! OPTIONS PS=256;
31
Chapter 9 : The effect of light on Meadowfoam flowering
Plot of the raw data
Plot of FLOWERS*INTENSity. Symbol is value of TimeName.
FLOWERS |
|
80 +
| E E
| L
| E
|
| E
70 +
| E
|
|
| E
| L L
60 + E
|
| E
| L
| E
| E
50 + L
|
|
| L L E
|
| L
40 + L
|
| L
|
|
| L
30 +
|
---+----------------+----------------+----------------+----------------+----------------+-
150 300 450 600 750 900
INTENSity
NOTE: 2 obs hidden.
First examine the raw data plot. Note the expression of the first letter from “Early” and “Late”.
The first model was fitted as a SLR to the quantitative variable “TIME”.
32 Title2 'Initial fit of the raw data to TIME';
NOTE: There were 24 observations read from the data set WORK.MEADOWFOAM.
NOTE: The PROCEDURE PLOT printed page 2.
NOTE: PROCEDURE PLOT used (Total process time):
real time 0.06 seconds
cpu time 0.00 seconds
33 PROC REG DATA=Meadowfoam lineprinter;
34 MODEL Flowers = time; RUN;
NOTE: The PROCEDURE REG printed page 3.
NOTE: PROCEDURE REG used (Total process time):
real time 0.06 seconds
cpu time 0.02 seconds
35
Chapter 9 : The effect of light on Meadowfoam flowering
Initial fit of the raw data to TIME
The REG Procedure
Model: MODEL1
Dependent Variable: FLOWERS
Number of Observations Read 24
Number of Observations Used 24
Analysis of Variance
Sum of Mean
Source DF Squares Square F Value Pr > F
Model 1 886.95034 886.95034 5.65 0.0265
Error 22 3450.98592 156.86300
Corrected Total 23 4337.93627
Root MSE 12.52450 R-Square 0.2045
Dependent Mean 56.13750 Adj R-Sq 0.1683
Coeff Var 22.31039
Parameter Estimates
Parameter Standard
Variable DF Estimate Error t Value Pr > |t|
Intercept 1 37.90000 8.08453 4.69 0.0001
TIME 1 12.15833 5.11310 2.38 0.0265
The next model was fitted as a SLR to the quantitative variable “intensity”.
36 Title2 'Initial fit of the raw data to INTENSITY';
37 PROC REG DATA=Meadowfoam lineprinter;
38 MODEL Flowers = Intensity;
39 output out=next r=resid;
40 RUN;
41
NOTE: The data set WORK.NEXT has 24 observations and 6 variables.
NOTE: The PROCEDURE REG printed page 4.
NOTE: PROCEDURE REG used (Total process time):
real time 0.10 seconds
cpu time 0.04 seconds
Chapter 9 : The effect of light on Meadowfoam flowering
Initial fit of the raw data to INTENSITY
The REG Procedure
Model: MODEL1
Dependent Variable: FLOWERS
Number of Observations Read 24
Number of Observations Used 24
Analysis of Variance Sum of Mean
Source DF Squares Square F Value Pr > F
Model 1 2579.75004 2579.75004 32.28 <.0001
Error 22 1758.18622 79.91756
Corrected Total 23 4337.93627
Root MSE 8.93966 R-Square 0.5947
Dependent Mean 56.13750 Adj R-Sq 0.5763
Coeff Var 15.92458
Parameter Estimates
Parameter Standard
Variable DF Estimate Error t Value Pr > |t|
Intercept 1 77.38500 4.16119 18.60 <.0001
INTENSity 1 -0.04047 0.00712 -5.68 <.0001
42 options ps=52 ls=111;
43 proc plot data=next; TITLE2 'Plot of the raw data';
44 plot resid * Intensity = TimeName;
45 RUN;
45 ! OPTIONS PS=256;
NOTE: There were 24 observations read from the data set WORK.NEXT.
NOTE: The PROCEDURE PLOT printed page 5.
NOTE: PROCEDURE PLOT used (Total process time):
real time 0.07 seconds
cpu time 0.02 seconds
46
Note the general separation in the “E” and “L” groups below. The were not included in this model.
Chapter 9 : The effect of light on Meadowfoam flowering
Plot of the raw data
Plot of resid*INTENSity. Symbol is value of TimeName.
resid |
|
15 +
|
| E E
| E E
|
10 + E
|
|
|
| L
5 +
| E E
| L E
|
| L
0 +
| E E
| E L
|
| L
-5 +
|
| L
|
| L
-10 + L L
| L
|
|
| L
-15 +
| L
|
|
|
-20 +
|
---+----------------+----------------+----------------+----------------+----------------+--
150 300 450 600 750 900
INTENSity
NOTE: 1 obs hidden.
47 Title2 'Multiple regression';
48 options ps=512 ls=111;
49 PROC REG DATA=Meadowfoam lineprinter;
50 MODEL Flowers = Intensity time;
51 output out=next r=resid p=YHat;
52 RUN;
NOTE: The data set WORK.NEXT has 24 observations and 7 variables.
NOTE: The PROCEDURE REG printed page 6.
NOTE: PROCEDURE REG used (Total process time):
real time 0.14 seconds
cpu time 0.08 seconds
Chapter 9 : The effect of light on Meadowfoam flowering
Multiple regression
The REG Procedure
Model: MODEL1
Dependent Variable: FLOWERS
Number of Observations Read 24
Number of Observations Used 24
Analysis of Variance
Sum of Mean
Source DF Squares Square F Value Pr > F
Model 2 3466.70039 1733.35019 41.78 <.0001
Error 21 871.23588 41.48742
Corrected Total 23 4337.93627
Root MSE 6.44107 R-Square 0.7992
Dependent Mean 56.13750 Adj R-Sq 0.7800
Coeff Var 11.47374
Parameter Estimates
Parameter Standard
Variable DF Estimate Error t Value Pr > |t|
Intercept 1 59.14750 4.95447 11.94 <.0001
INTENSity 1 -0.04047 0.00513 -7.89 <.0001
TIME 1 12.15833 2.62956 4.62 0.0001
Is there an interpretation of the slope and intercept? Can plants grow flowers if light intensity is zero? The units on the slope is “flowers per mmol/m2/sec of light intensity”
Calculation of Extra Sum of Squares.
SSXT = 886.95034
SSXI = 2579.75004
SSXT | XI = 3466.70039 – 2579.75004 = 886.95034
SSXI | XT = 3466.70039 – 886.95034 = 2579.75004
How come the SS for each variable is not modified by the other???
52 ! OPTIONS PS=45;
53 TITLE3 'Plot of residuals';
54 Proc plot; PLOT resid*Intensity=timename / vref=0;
NOTE: There were 24 observations read from the data set WORK.NEXT.
NOTE: The PROCEDURE PLOT printed page 7.
NOTE: PROCEDURE PLOT used (Total process time):
real time 0.13 seconds
cpu time 0.03 seconds
Chapter 9 : The effect of light on Meadowfoam flowering
Multiple regression
Plot of residuals
Note that there is no longer appreciable separation in the “E” and “L” groups.
Plot of resid*INTENSity. Symbol is value of TimeName.
resid |
15 +
|
|
| L
|
|
10 +
| L
|
| E
| E L
| E E
5 +
| L
| E
|
| L
|
0 +--E---------------------------------------------------------------------------------------
|
| E L
| E E
| L L
| L
-5 + L
|
| E
| L E
| E
|
-10 + L
|
---+----------------+----------------+----------------+----------------+----------------+--
150 300 450 600 750 900
INTENSity
55 Proc plot; PLOT resid*YHat=time / vref=0;
56 RUN;
56 ! options ps=512 ls=111;
57
NOTE: There were 24 observations read from the data set WORK.NEXT.
NOTE: The PROCEDURE PLOT printed page 8.
NOTE: PROCEDURE PLOT used (Total process time):
real time 0.04 seconds
cpu time 0.00 seconds
Chapter 9 : The effect of light on Meadowfoam flowering
Multiple regression
Plot of residuals
Plot of resid*YHat. Symbol is value of TIME.
resid |
15 +
|
|
| 1
|
|
10 +
| 1
|
| 2
| 1 2
| 2 2
5 +
| 1
| 2
|
| 1
|
0 +-----------------------------------------------------------------------------------------------2--------
|
| 1 2
| 2 2
| 1 1
| 1
-5 + 1
|
| 2
| 1 2
| 2
|
-10 + 1
|
---+----------+----------+----------+----------+----------+----------+----------+----------+----------+--
35 40 45 50 55 60 65 70 75 80
YHat
58 PROC UNIVARIATE DATA=NEXT NORMAL PLOT; VAR resid;
59 RUN;
NOTE: The PROCEDURE UNIVARIATE printed page 9.
NOTE: PROCEDURE UNIVARIATE used (Total process time):
real time 0.05 seconds
cpu time 0.02 seconds
60
Chapter 9 : The effect of light on Meadowfoam flowering
Multiple regression
Plot of residuals
The UNIVARIATE Procedure
Variable: resid
Moments
N 24 Sum Weights 24
Mean 0 Sum Observations 0
Std Deviation 6.15465847 Variance 37.8798209
Skewness 0.21089332 Kurtosis -1.0360321
Uncorrected SS 871.23588 Corrected SS 871.23588
Coeff Variation . Std Error Mean 1.2563144
Basic Statistical Measures
Location Variability
Mean 0.00000 Std Deviation 6.15466
Median -1.55821 Variance 37.87982
Mode . Range 21.81715
Interquartile Range 10.11845
Tests for Location: Mu0=0
Test -Statistic- -----p Value------
Student's t t 0 Pr > |t| 1.0000
Sign M -1 Pr >= |M| 0.8388
Signed Rank S -2 Pr >= |S| 0.9559
Tests for Normality
Test --Statistic--- -----p Value------
Shapiro-Wilk W 0.955588 Pr < W 0.3563
Kolmogorov-Smirnov D 0.126766 Pr > D >0.1500
Cramer-von Mises W-Sq 0.068129 Pr > W-Sq >0.2500
Anderson-Darling A-Sq 0.405333 Pr > A-Sq >0.2500
Quantiles (Definition 5)
Quantile Estimate
100% Max 12.16488
99% 12.16488
95% 8.80631
90% 7.18940
75% Q3 5.70405
50% Median -1.55821
25% Q1 -4.41441
10% -7.62298
5% -8.25202
1% -9.65226
0% Min -9.65226
Extreme Observations
------Lowest----- ------Highest-----
Value Obs Value Obs
-9.65226 9 6.67726 16
-8.25202 17 7.01845 12
-7.62298 7 7.18940 21
-7.51060 22 8.80631 6
-6.98131 20 12.16488 2
Stem Leaf Boxplot Normal Probability Plot
12 2 1 | 13+ *+++
10 | | +++
8 8 1 | | ++*+
6 702 3 | | **+*
4 68 2 +-----+ | **++
2 79 2 | | | **+
0 49 2 | + | | ++**
-0 83 2 *-----* | ++* *
-2 95962 5 | | | *****
-4 0 1 +-----+ | ++*
-6 650 3 | | *+**
-8 73 2 | -9+ * +*++
----+----+----+----+ +----+----+----+----+----+----+----+----+----+----+
-2 -1 0 +1 +2
Other models discussed by the text
Simple linear regression: ![]()
Basic multiple linear regression: ![]()
![]()
Polynomial regression: ![]()
![]()
Multiple regression with interaction: ![]()
Multiple regression with transformation: ![]()
Analysis of covariance is a least squares model that has a mix of quantitative variables (typical regression variables) and indicator variables (binary variables coded as 0 or 1). The models fitted are as follows:
Simple linear regression: ![]()
Basic multiple linear regression: ![]()
When
group = 0: ![]()
When
group = 1: ![]()
multiple linear regression with interaction: ![]()
When
group = 0: ![]()
When
group = 1: ![]()
A note on extra SS.
SAS recognizes 4 types of sum of squares in various procedures (especially PROC GLM). However, only two types of SS apply to regression. These are called TYPE I SS (or sequential SS) and TYPE II SS (or partial SS). For regression TYPE III and TYPE IV are the same as TYPE II (partial SS).
For the SAS model: MODEL Y = X1 X2 X3 X4; SAS would fit the following TYPE I and TYPE II sums of squares.
|
Variable |
Type I SS |
Type II, III or IV SS |
|
X1 |
SSX1 |
SSX1|X2, X3, X4 |
|
X2 |
SSX2|X1 |
SSX2|X1, X3, X4 |
|
X3 |
SSX3|X1, X2 |
SSX3|X1, X2, X4 |
|
X4 |
SSX4|X1, X2, X3 |
SSX4|X1, X2, X3 |
Indicator variables – Non quantitative variables, called CLASS variables, GROUP variables or indicator variables are ANOVA type variables. These distinguish between groups such as freshman, sophomore, junior and senior or Male and Female. They require, as a group, one less degree of freedom than there are groups, as we saw in ANOVA (i.e. t groups require t – 1 d.f.)
These variables are coded in the analysis as 0 and 1, similar to the contrasts we saw in ANOVA. Also, as with ANOVA, the indicator variable will fit the difference between means for the various groups. When included in regression the indicator variable will fit differences in levels or intercepts.
Indicator variables are usually treated as a group, so SAS will report the SS for the group of variables. If, for example, we had the CLASS variable “YEAR” with levels [freshman, sophomore, junior and senior], SAS would calculate a single sum of squares for the group with 3 d.f.
Analysis of Covariance – a combination of quantitative and indicator variables
61 Title2 'Analysis of Covariance';
62 options ps=512 ls=111;
63 PROC GLM DATA=Meadowfoam;
64 MODEL Flowers = Intensity time0 intensity*time0;
65 RUN;
66 quit;
NOTE: The PROCEDURE GLM printed pages 10-11.
NOTE: PROCEDURE GLM used (Total process time):
real time 0.09 seconds
cpu time 0.04 seconds
67 ODS HTML close;
Chapter 9 : The effect of light on Meadowfoam flowering
Analysis of Covariance
The GLM Procedure
Number of Observations Read 24
Number of Observations Used 24
Dependent Variable: FLOWERS
Sum of
Source DF Squares Mean Square F Value Pr > F
Model 3 3467.276422 1155.758807 26.55 <.0001
Error 20 870.659845 43.532992
Corrected Total 23 4337.936267
R-Square Coeff Var Root MSE FLOWERS Mean
0.799292 11.75320 6.597954 56.13750
Source DF Type I SS Mean Square F Value Pr > F
INTENSity 1 2579.750045 2579.750045 59.26 <.0001
Time0 1 886.950342 886.950342 20.37 0.0002
INTENSity*Time0 1 0.576035 0.576035 0.01 0.9096
Source DF Type III SS Mean Square F Value Pr > F
INTENSity 1 1328.712043 1328.712043 30.52 <.0001
Time0 1 153.216013 153.216013 3.52 0.0753
INTENSity*Time0 1 0.576035 0.576035 0.01 0.9096
Standard
Parameter Estimate Error t Value Pr > |t|
Intercept 71.62333349 4.34330481 16.49 <.0001
INTENSity -0.04107619 0.00743505 -5.52 <.0001
Time0 11.52333336 6.14236056 1.88 0.0753
INTENSity*Time0 0.00120952 0.01051475 0.12 0.9096
Polynomials – models employing successive power terms (all terms must be included up to the highest power used in the model.) These should be fitted with TYPE I SS.
![]()
Polynomials: With X and X2 it is
called a Quadratic curve 
It is not necessary to fit the full sweep of the
curve. 
Cubic models have X, X2 and X3.
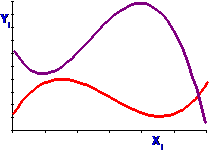
Again, it is not necessary to fit the full sweep
of the curve. 
Quartic model (X, X2, X3
and X4):