----------------------------------------------------------------------------------------------------------------------------
The dataset for today is ex1320.csv. I recommend you use PROC MIXED or PROC GLM (or both) for this example. There are no random effects, so the problem is appropriate for either.
data ACTSCORES;
infile input1 missover DSD dlm="," firstobs=2;
input gender $ profile $ score;
datalines;
run;
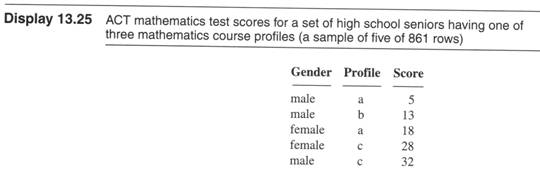
The variable “profile” has 3 levels: “a” indicates Algebra I only, “b” indicates two algebra courses plus geometry and “c” indicates two algebra courses plus geometry, trigonometry, advanced math and beginning calculus.
1) You do NOT need to list the data, there are 861 observations. To examine the data you may wish to sort by gender and profile and get means by gender and profile. “proc sort; by gender profile; proc means; by gender profile;”.
2) Using GLM or MIXED fit the model including the interaction, “MODEL SCORE = GENDER PROFILE GENDER*PROFILE;” or “MODEL SCORE = GENDER | PROFILE;”.
State your conclusions on the significance of gender, profile and the interaction. You may use the back of this page or you may email your answers.
3) Output the lsmeans or get means from PROC MEANS and plot the means. The Y axis will be the value of the mean, the X axis will be the profile value (a, b or c) and the letters within the plot should indicate male or female.
State your interpretation of the interaction. Obviously, this will be more interesting if the interaction is significant than if it is not. You may use the back of this page or you may email your answers.