The objective of this assignment is to run a MULTIPLE regression with linear and quadratic terms and interaction. You may use the following input statements. Note that if you use power terms or interactions with PROC REG you need to create these terms in the data step.
data CornYield; infile input1 missover DSD dlm="," firstobs=2;
input YEAR YIELD RAINFALL;
Rainfall2 = Rainfall*Rainfall; /* rainfall squared */
Rainfall_Year = Rainfall*Year; /* rainfall interaction */
datalines;
run;
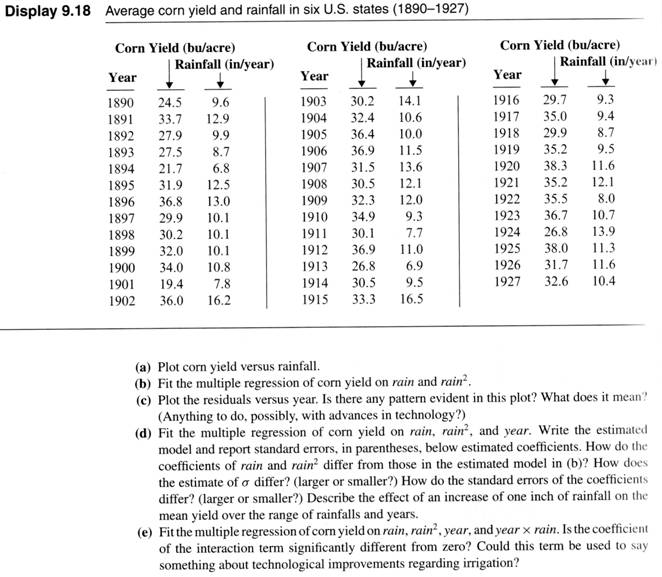
a) The homework is based on problem 9.15 which is used as an example by your text, and has more detailed explanation in the chapter. The exercise from the book is on the back of this page. The dataset is ex0915.csv.
b) Arrange for the usual comments and title, and HTML output dataset to the C:\temp\ directory.
c) Create a scatter plot following the textbooks instructions for 9.15a and 9.15c.
d) Run 3 regression models as described in sections 9.15b, 9.15d and 9.15e.
e) In addition to the tasks above, include a residual plot and proc univariate of the residuals to check for normality. Do this for the last model only.
The book asks a lot of questions you need not consider. Answer the following questions only. Please attach the answer to your email.
a) Does the quadratic term, fitting curvature to corn yield on rainfall, improve the model (yes or no)? Give the p-value.
b) Does the addition of “year” (supposedly fitting some technological advance) improve the model (yes or no)? Give the p-value.
c) Does the addition of the interaction term (suggesting that the effect of rainfall is not consistent from year to year, figure that one) improve the model (yes or no)? Give the p-value.
d) Do the assumptions of normality and homogeneity appear to be met? Yes or no, no p-values needed (I trust you).